The international scientific and analytical, reviewed, printing and electronic journal of Paata Gugushvili Institute of Economics of Ivane Javakhishvili Tbilisi State University
ROLE OF THE AGE FACTOR IN THE FORMATION OF COUNTRY’S ECONOMY AND POPULATION’S INCOME[1]
Summary
One of the crucial factors affecting the development of a country’s economy is the demographic structure and education level of its population. – Other things being equal, the more educated, qualified and capable of working individuals the country comprises, the higher its potential for economic development. As a result, it is highly important to consider participation of economically active population in the process of employment and creation of economic wealth according to their age. Moreover, it is noteworthy to pay attention to the correlation of wealth distribution and its final consumption with regard to various age groups – i.e., whether there is a correlation between the wealth, created by those age groups, and its actual consumption. Georgia belongs to one of those societies, which are founded on traditional values, where cultural-emotional, existential, material and economic connections between different generations are strong. The scale of inner family and interfamily assistance among the representatives of older and younger generations is high. This assistance includes many aspects –gender, age, educational, professional, territorial, etc. Data from the National Statistics Office of Georgia, alongside special research enable us to acquire in depth information and make long-term conclusions as well as adequate recommendations about mentioned attitudes and processes.
Key words: young generation, age grouping, ageism, intergenerational relations
Introduction
In terms of labor market and employment, situation for the representatives of low age group, at first glance, is quite serious in modern Georgia: Among other things, unemployment rate is above the average (according to the 2016 data, between the ages of 15-19 - 31.9%;20-24 - 30.0%; 25-29 - 21.6%, on average in country’s economy - 11.8%). Although, among economically active population, individuals aged 15-29, in other words, that contingent, who has recently graduated from universities and became involved in economic activities, is the best provided for in terms of qualitative factors (employment profile and remuneration). In this age group more than half of the economically active population falls on employees (50.2%), whereas, on average, it does not exceed 37.3 percent in national economy; in the mentioned age group (25-29), every 100 self-employed stands against the 180 employed, whereas the average number is only 74. Fact is the problem of employment remains the number one challenge for the young generation. However, for those employed youth, qualitative indices of employment (taking in view that the salary of the employed is considerably higher than that of the self-employed) significantly exceed that of the other age groups.
It is important to note that since 1990s the age of the employed, in terms of the highest received salary, has undergone a significant evolution. Unlike 1990s, when the people aged 45-55 generated the highest income[2], by 2010s the age group of 25-29 took over as leaders with “yellow t-shirts” (to use sports terminology). This trend was proved by the selective research of the population conducted in various cities of Georgia (Tbilisi, Kutaisi, Kaspi), according to which the average income of the 25-29 age group was nearly 1.2 higher than the average income of the country, whereas the salary of the people aged above 45 went down by almost ¼. In the beginning of 1990s, the income of the youth aged under 30 was 10-30 percent lower than the average number; on the other hand, those aged above 45 received income, which was higher by 2.2. We can now assert that the optimal age of the employed for the highest income has been sharply (approximately 15-20 years) reduced in the last decades and today it has approached the age margin of 30.
Table 1
Average monthly income of the employed
According to age groups
|
Age |
Average monthly income |
|
|
Georgian Lari |
Percentage (On average in the country - 100) |
|
|
On average in the country: |
883.4 |
100.0 |
|
Among them: |
|
|
|
<20 |
834.8 |
94.5 |
|
20-24 |
933.1 |
105.6 |
|
25-29 |
1042.0 |
118.0 |
|
30-34 |
891.4 |
100.9 |
|
35-39 |
1045.9 |
118.4 |
|
40-44 |
826.5 |
93.56 |
|
45+ |
674.9 |
76.4 |
The above-mentioned regularity can be explained by the ease with which the youth, as a rule, can adapt to the market economy, and their mobility or the knowledge of information technologies and languages makes them easily adaptable to the circumstances and substantially increases their competitive advantage in the labor market.
For instance, young people under the age of 20, who are employed and at the same time, do not have incomplete (bachelor’s degree), let alone, complete higher education, can still receive an almost average level salary (94.5%).
It is a general rule that education brings higher income. The income (1068.3 gel) of those people who receive higher education is 21% more than the average income (883.4 gel), 46% more than the income of those who possess secondary education (733.7 gel), and 84% more than the income (581.4 gel) of individuals who receive incomplete education.
Students (including holders of incomplete higher education) earn 8.3% more income (956.4 gel) than the average figure. It is possible to assert categorically that, despite the low employment level among youth, and a high level of unemployment, the income and condition of those individuals who manage to land a job and start working is better than that of the average employee.
Data that was derived from the research conducted by the institute of demography is in high correlation with the data received from analyzing the whole country of Georgia. To the question: how does the overall income of a family satisfy various needs of its members? Only 3.6% answered –fully, 9.3% answered – sufficiently, 44.8% responded – more or less, and for 42.2% of the respondents the income does not meet their family’s needs.
As a point of fact, this data indicates that 3.6% of Georgia’s population is rich, 9.3% - wealthy, 44.8% is in the category of average income, and 42.2% - poor and destitute.
Income of those people who think that their current revenues fully satisfy their families’ needs (approximately 2000 gel monthly), is nearly 2.5 times more than the actual average income of other families. In other words, fully meeting families’ ongoing needs necessitates the average income to be 2.5 times higher than the actual average income. According to the similar approach, in order to sufficiently satisfy families’ needs, it is necessary that the current income be no less than 1.8-2.0 times higher than the actual one. Consequently, it can be inferred that, as of today, more than ¾ of the households is not satisfied by their income.
In the conditions where household revenues, as a rule, are formed from different sources, the mentioned discontentment indicates that despite their diversity, separately or together, they cannot provide the households with a desired level of income.
The share of those families, which earn income in Georgia, is quite considerable (68%). However, if we take into account the fact that families demand higher income to meet their needs, we can divine that a salary cannot fulfill its basic economic function. This situation is further confirmed by the instances of financial support, which every tenth family receives from their relatives and loved ones, as well as every seventh – from their relatives, and family members that are residing abroad as work migrants. Apart from that, as little as every sixth household (17.1%) generates revenues from their businesses. These point to the unsatisfactory development level of market relations and indicate little involvement on the side of the households.
Despite the survey having been conducted in cities, we can say that among those individuals who work in agriculture (every fourth household – 24.1%), only 21% produce agricultural commodities. This type of material income is characterized by the same intensity as the renting of real and moveable estates.
Georgia was and remains the country whose society is primarily defined as the one possessing intergenerational relationships of traditional nature. According to surveys, 43.2% of the population still lives with their parents. As these individuals get older the above-mentioned figure, understandably, goes down. In youth aged just below 20 this number is 77.1%, in youngsters aged 20-24 – 65.4%, in the population aged 25-40 the figure stays virtually on the same level (between 41-45%), and then it sharply decreases again to the point where among the people aged above 45 the figure amounts only to 24.3%.
Two-thirds (66.8%) of the interviewed population, with varying degrees, links financial situation to the possibility of living separately from their parents. Working (64.5%) and living conditions (64.7%), which fall just a little behind the financial situation, also determine the possibility of independence.
Interviewees consider starting independent life positively in several aspects of life. The number of those who think that their conditions will improve, in case of living separately, is 7.4 times higher than the number of people who think otherwise (34.0% and 4.6% respectively).With regard to employment, the difference is still tremendous – 10.4 times higher (17.6% and 1.7%). At the same time, in spite of positive and optimistic expectations, enthusiasm and positive expectations associated with independent living are relatively modest (25.8% and 17.7% respectively).
Until recently, Georgian family has been deemed a cornerstone of traditional values. Nevertheless, transition to the model of market economy and general deterioration of the population’s conditions introduced some changes there as well. The survey showed that only 2.6% of the overall population provides any kind of assistance to their parents, whereas almost the third – 32.2% - of the population grants none whatsoever. Similar number – 31.3% - is happy to give only moral assistance, while the share of those who provide financial and material help hardly exceeds 20.6%.
Naturally, scales and range of assistance depend on many factors. As of late, the age of those people who receive income and revenues reflected in peak numbers, as was mentioned before, has substantially gone down, and this age group (up to 30 years of age) has fallen under the regime of “double preference”. On the one hand, their salary is higher than or equivalent to the average income, on the other hand, because of traditional relationships, the scale of parental or grandparental assistance toward those younger age groups is high. In addition to this, relationship processes marked with certain specificity exist here too, among other things there are gender aspects. For example, if the indicator of “cannot help” is virtually equal between genders (31.5% of men and 32.6% of women cannot provide support to their parents), it is not the same with financial support, where men are able to offer nearly three times more assistance to their parents than women (17.8% and 6.3% respectively). The scales of material and physical support in terms of gender are almost equal, whereas the degree of empathy or moral support is manifested (nearly 1.7 times more frequent), much more among women than among men (36.7% and 22.1% respectively).
Naturally, as children get older and their age goes up, parental support becomes scarce and vice versa, scales of children’s support toward their parents increase. Among the interviewed individuals aged below 20 almost 2/3 cannot provide any kind of financial support whatsoever for their parents (rather they are in need of support themselves!), among the people aged 20-24 the figure comes down to 43.8% and only 25.3% for those who are more than 45 years old. Alternatively, upward movement characterizes scale and intensity of support from children toward their parents as the former get older: if we compare instances of financial support from the interviewed children between those who are aged below 25 and those above 40, we will notice a stark difference, namely 1.3% and more than 14% respectively. Intensity of physical support increases from 7.5% in the people aged 20-24 to 16.2% in the respondents aged above 45. In fact, the intensity of physical support does not change with the passage of years, and among the individuals that have left behind teenage years (20<) the scale of moral support is quite stable as well (33.0 %<). The mentioned figure decreases just a little bit for only those respondents who are aged above 45 – this as a rule, is the result of passing away of their parents.
Table 2
Childrens support toward their parents
According to childrens age group
|
|
Children’s age |
||||||
|
|
<20 |
20-24 |
25-29 |
30-34 |
35-39 |
40-44 |
45+ |
|
None |
63.6 |
43.8 |
41.3 |
28.2 |
31.7 |
18.3 |
25.3 |
|
Financial |
0.0 |
1.3 |
9.8 |
11.8 |
13.4 |
14.0 |
14.1 |
|
Material |
0.0 |
7.5 |
7.6 |
4.5 |
12.2 |
15.1 |
16.2 |
|
Physical |
13.6 |
12.5 |
10.9 |
17.3 |
11.0 |
15.1 |
12.1 |
|
Moral |
18.2 |
33.8 |
28.3 |
37.3 |
30.5 |
33.3 |
27.3 |
|
Any kind |
4.5 |
1.3 |
2.2 |
0.9 |
1.2 |
4.3 |
5.1 |
|
Total |
100.0 |
100.0 |
100.0 |
100.0 |
100.0 |
100.0 |
100.0 |
Scales of children’s support toward their parents expressed in the form of money are substantial – 110.9 gel monthly[3]. At the same time, men provide 1.5 times more assistance to their parents than women (135.1 gel and 90 gel respectively), which, essentially, correlates to the differences reflected in salary levels between genders. The distinction in the levels of support is also marked by territorial aspect. Specifically, residents of Tbilisi provide almost 2 times more support to their parents than people living in Kutaisi (139.2 gel and 71.5 gel, respectively)[4], likewise the support coming from people with higher education is twice the number of those individuals’ support who do not receive complete education (161.1 gel and 66.7 gel correspondingly). The difference in the possibilities of support toward parents is larger still among the employed and unemployed individuals– those having a job allot 2.3 times more funds for support than those who are jobless (149.1 gel and 63.9 gel respectively).
The capacity for providing support reaches its peak among 35-39-year-olds (142.6 gel), after which it gradually goes down (among 40-44-year-old donors scales of support amount to 133.1 gel, whereas people aged above 45 can only yield as much as 89.0 gel).
Children mostly tend to assist their parents when the former reach somewhere between 35-39 years of age. The highest share of such assistance in relation to their income falls on 40-44-year-old individuals.
The fact that every second person supports parents materially on the daily basis or per their demand speaks to the preservation of traditional relationships and caring in families. Aside from that, the number of those people who can only help their parents weekly (16.9%) or monthly (29.9%) is rather big.
The process of support between the members of different generations has a bilateral character. It flows from the members of young generation toward the members of older generation, and vice versa. Almost 3/5 of the population receives financial (33.9%) and material (21.7%) support from their parents. On top of that, if we compare the flows, intensity and size of support, we will discover that the parents’ assistance toward their children is more noticeable and they help them much more often than the other way around. The chart below illustrates what we have already said.
Chart 1

It goes without saying that the data presented above essentially shows the kind of support parents and children give each other. However, there are several types of support instead of a single one, as a rule.
The chart also confirms the fact that the intensity of support from parents toward children is multiple times higher than the other way around. In addition to that, we have to consider the difference of age between generations and take into account the fact that from certain age mark members of parents’ generation earn less and less income than, in the same time period, members of their children’s generation.
Consequently, children’s generation possesses more resources for managing final income and consumption, than it is generally reflected in the revenues established after primary income. Apart from that, parents’ ratio of income/support toward their children is substantially high than the other way around.
Chart 2
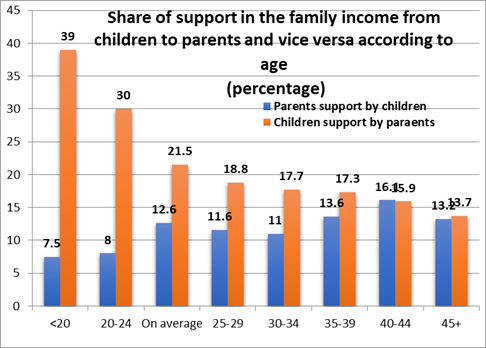
Children’s age and support toward parents are in a positive correlation with each other, whereas parents’ age and support toward children are in a negative one. Scale of support among the expenses of the parents aged 35-39 is larger than among children’s expenses, only after passing the mentioned age mark does the situation start to change in the opposite direction. What is more, with regard to the children aged below 24, parents’ size of support toward such children significantly exceeds the quantity of average income allotted for each member of a family. In particular, according to the average number of family members, each member, on average, receives 27% of the family’s income, whereas for every family member who is aged below 20, the size of support virtually becomes 39%, and for those aged between 20 and 24 – 30%. Naturally, as the age of recipients goes up, they receive less support from their parents. This is clearly illustrated in the following chart.
Chart 3

Based on the logic and law of economics, students get the most generous support (358.1 GEL), and the least support is allotted to contractors (134.1 GEL) and self-employed individuals (126.7 GEL).
When children and parents live together, the share of only parents in providing material support is higher, than the share of only children (31% and 1% respectively). At the same time, only the spouses’ share, which amounts nearly to 2/3 (62.5%), is eminently high.
Depending on what role parents and children assume – donors (givers of support) or recipients (receivers of support), scales of support vary to a certain degree. However, in the category of parents as well as children, the third of the interviewed people show support per request from others, whereas the share of those who grant such support, at least once a year, is quite small.
Table3
Degree of support between parents and children
(Percentage)
|
|
Daily |
Once a week |
Monthly |
At least once a year |
per request |
Total |
|
Parents support their children |
9.4 |
9.6 |
44.8 |
4.7 |
31.6 |
100 |
|
Children support their parents |
16.1 |
16.9 |
29.9 |
3.8 |
33.2 |
100 |
Almost 2/3 (63.4%) of the Georgia’s population that are in the economically active age do not have grandparents any more. The absolute majority of the rest (85.2%), as a rule, not only visits grandparents periodically, but also is able to introduce them to their friends. In addition, 1/3 or 32.7% of grandchildren do not provide any support to their grandparents; 13.5% help their grandparents financially or materially and the rest limit themselves to only physical or moral help.
An average monthly value of support given by grandchildren to their grandparents is 57.4 GEL. The size of such support is the biggest from those grandchildren, who have received higher education (74.6 Gel).
28.4% of grandparents cannot give any kind of support to their grandchildren. 30.2% of them grant financial and 12.9% - material support; the rest are limited to physical or moral help.
The table below shows the character and intensity of mutual support, on the one hand from grandparents and on the other from grandchildren, toward each other.
Table 4
Characteristics of support between grandparents and grandchildren
(Percentage)
|
|
Grandchildren support their grandparents |
Grandparents support their grandchildren |
|
None |
32.7 |
28.4 |
|
Financial |
5.6 |
30.2 |
|
Material |
7.9 |
12.9 |
|
Physical |
23.5 |
6.1 |
|
Moral |
30.2 |
22.3 |
|
An average monthly size of help, Gel |
57.4 |
71.4 |
Only insignificant part of the population (1.7%) thinks that the government must be solely responsible for the care of the elderly. The majority (35.4%) recognizes this process to be the duty of children and grandchildren or to be equally shared (63.0%) between the former and the government.
As the presented data confirm, despite various kinds of difficulties, among them of economic character, intergenerational bond is still considerably firm in Georgia and it is reflected in mutual support (from older generation toward younger one and vice versa). On top of that, this relationship is not limited to the relations between children and parents; rather it includes the strong bond between grandparents and their grandchildren. It is also natural that the economic ties and scales or intensity of support is much stronger between parents and children than between grandparents and grandchildren. This fact is demonstrated in the table below.
Table 5
Intensity of intergenerational support and an average monthly cost
(Percentage)
|
|
Younger generation’s support toward the older one |
Older generation’s support toward the younger one |
||
|
|
Children support their parents |
Grandchildren support their grandparents |
Parents support their children |
Grandparents support their grandchildren |
|
None |
32.2 |
32.7 |
14.9 |
28.4 |
|
Financial |
10.6 |
5.6 |
33.9 |
30.2 |
|
Material |
10.0 |
7.9 |
21.7 |
12.9 |
|
Physical |
13.3 |
23.5 |
3.3 |
6.1 |
|
Moral |
31.3 |
30.2 |
21.9 |
22.3 |
|
Any kind |
2.6 |
0.1 |
4.3 |
0.1 |
|
An average monthly size of support, Gel |
110.9 |
57.4 |
189.5 |
71.4 |
As it is clear from the data above, children’s support toward their parents expressed in money is 1.9 times more than the support given to grandparents by the same individuals; moreover, parents’ support toward their children is almost 2.7 times higher than that of grandparents. Generally, the size of support toward parents is nearly 1.5 times more intensive than toward grandparents (20.6% and 13.5% respectively); furthermore, parents’ material and financial support toward their children is significantly dominant over grandparents’ support for their grandchildren (55.6% and 43.1% respectively). It must also be noted that, with regard to physical support toward each other, the figure among younger generation is considerably larger than the same figure among older generation (approximately four times higher).
Conclusion
Consequently, there are certain principles at play here, which the government must necessarily take into account when coming up with and implementing social-economic policy. Namely:
- Intergenerational economic and emotional relationships are retained in Georgia on a substantially high level; a large number of households are represented by two or more generations;
- The scales of economic support have a two-way opposite vectors –support flows toward younger generation from the older one and vice versa;
- The size of support from the members of older generation toward the members of younger generation decreases, as the recipients (receivers of support) get older. At the same time, the size of support from younger to older generation increases as the age of recipients goes up;
- The size of support from the members of older generation toward the members of younger one is multiple times bigger than the size of support in the opposite direction. The amount of actual consumption of the population aged below 25 not only exceeds the income of the same age group, but it is also higher than the average size of familial consumption per capita. Considering the number of population and the quantity of households in Georgia, the size of annual resources willingly passed from the members of older generation to the members of younger one exceeds 1.1 billion GEL, which comprises nearly 10% of the entire funds;
- Bilateral economic relationships and value of support between parents and children are more intensive and multiple times bigger than between grandparents and grandchildren;
- According to the size of income, maximal age interval is characterized by a clearly expressed tendency of reduction; compared to the 1990s, the mentioned figure has been reduced by nearly 15-20 years;
- Distribution of the primary income takes place between older and younger generations with the latter being the recipient; simultaneously, this process is somehow leveled by the circumstance that, first of all, a large number of the population makes use of the inner family expenditure and secondly, a significant part of the certain components of social support (for example, healthcare) is directed toward fulfilling the needs of older generation. As a result, in today’s conditions, younger generation’s dominance over utilizing primary income of the whole population is apparent. This situation is, to some extent, compensated for by the older generation, whose members are able, though not completely, to maximize their own share in the social packages (healthcare, social security) reserved for collective usage.
Literature:
- Ioseb Archvadze. Concerning the welfare and various aspects of social-economic stratification of Georgian population. – Collection of works: power and society in Georgia. Tbilisi, “Universal”, 2009, p. 155-169.
- Ioseb Archvadze. Concerning certain tendencies of the population’s individual income. – I. Archvadze. Economy and time. Tbilisi, 200, p. 114-116.
- Material acquired from the National Statistics Office of Georgia.
- Material from the research: “peculiarities of the social-economic modernization of a family”, conducted in 2013 by the Iliauni Institute of demography in Tbilisi, Kutaisi and Kaspi.
- Avtandil Sulaberidze. Thinking about Georgian family and demography. – Tbilisi, 2007.
- Mzia Shelia. Research of transferts between generations in Georgia. Proceedings of Materials of International Scientific Conference Dedicated to the 65th birth anniversary of Professor George Tsereteli STRUCTURAL AND INNOVATIVE PROBLEMS OF ECONOMIC DEVELOPMENT. Tbilisi, 2017, pp. 181- 183.
- Evandrou et al., 2016 – Evandrou, M., Falkingham. J., Gomez-leon M., Vlaghantoni, A. (2016). Intergenerational flows of support between parents and adult children in Britain. Journal Aging & Society. Gambridge Univerity Press. pp. 1-31.
- Mzia Shelia. Ageing of Population in a Transitional Society: Case of Georgia
- a Institute of Demography. - European Journal of Social and Human Sciences, 2017, 4(2).
- Sulaberidze, 2016 – Sulaberidze A. (2016). Economic Transformation of the Family at the Transitional Stage in Georgia. Problems of Demography and Sociology. Collection of works. Tbilisi. pp. 102-10
[1]This article uses material from the research, “peculiarities of social-demographic modernization of a family”, which was conducted by the Iliauni Institute of demography in Tbilisi, Kutaisi and Kaspi in 2013.
[2]See I. Archvadze. Economics time. Tbilisi, 2000, p. 114.
[3]Although, this figure is 1.7 times lower than the monthly support of parents toward their children (189.0 GEL).
[4]According to the business sector, salaries in Tbilisi are 1.7 times higher than in Imereti that is largely represented by the city of Kutaisi.